An example of mixture function on multinomial random variables

Hi, I am trying to replicate the Poisson random variable example using mixture function in which we deal with two multinomial random variables.

x <- rbind(t(rmultinom(100, 1, c(0.1, 0.2, 0.7))),
           t(rmultinom(400, 1, c(0.2, 0.3, 0.5))))

head(x)
#>      [,1] [,2] [,3]
#> [1,]    0    0    1
#> [2,]    0    0    1
#> [3,]    0    1    0
#> [4,]    0    0    1
#> [5,]    0    0    1
#> [6,]    0    0    1

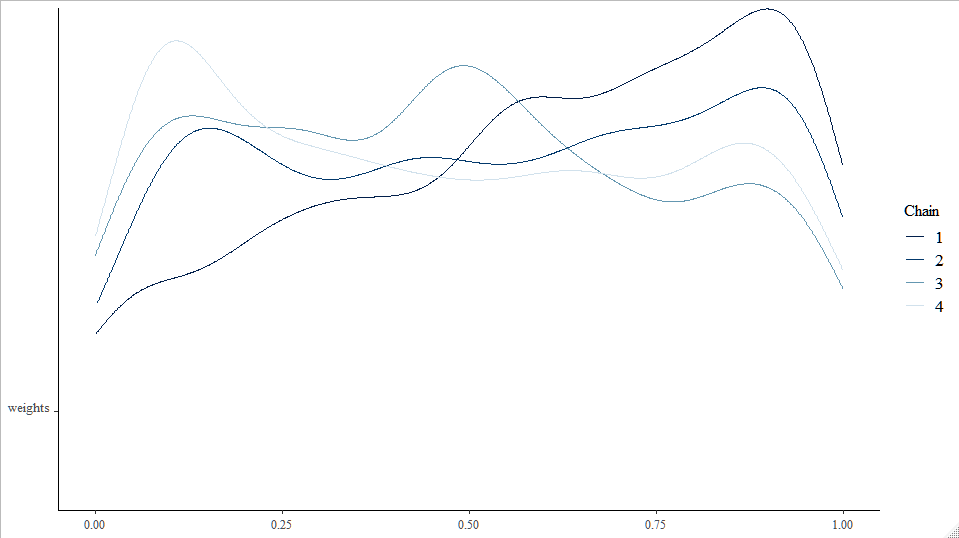
weights <- uniform(0, 1, dim = 2)
rates <- dirichlet(t(rep(1, 3)), n_realisations = 2)
distribution(x) <- mixture(multinomial(1, rates[1,]),
                           multinomial(1, rates[2,]),
                           weights = weights)
#> Error: left and right hand sides have different dimensions. The distribution must have dimension of either 500 x 3 or 1 x 1, but instead has dimension 1 x 3

I basically follow the same steps in the example and couldn’t figure out where I did it wrong. Can you help me with debugging this? Thank you.

BTW, I am a JAGS user for four years and just found this tool. It looks super cool and I regret not trying this earlier.

Hi, here is some update. I was able to make the program work and now it stops complaining. But it seems that greta wasn’t able to pick up the right weights.

library(greta)
library(tidyverse)

x <- rbind(t(rmultinom(1, 400, c(0.1, 0.2, 0.7))),
           t(rmultinom(1, 100, c(0.8, 0.1, 0.1)))) %>% colSums()

weights <- uniform(0, 1, dim = 1)
rates <- dirichlet(t(rep(1, 3)), n_realisations = 2)

dat <- t(x)
distribution(dat) <- mixture(multinomial(sum(x), rates[1,]),
                             multinomial(sum(x), rates[2,]),
                             weights = c(weights[1], 1-weights[1]))


m <- model(weights, rates)
draws_rates <- mcmc(m, n_samples = 1000)
#> 
#> running 4 chains simultaneously on up to 4 cores
#> 
    warmup ====================================== 1000/1000 | eta:  0s          
#>          
  sampling ====================================== 1000/1000 | eta:  0s
summary(draws_rates)
#> 
#> Iterations = 1:1000
#> Thinning interval = 1 
#> Number of chains = 4 
#> Sample size per chain = 1000 
#> 
#> 1. Empirical mean and standard deviation for each variable,
#>    plus standard error of the mean:
#> 
#>              Mean     SD Naive SE Time-series SE
#> weights    0.5130 0.2912 0.004604       0.020490
#> rates[1,1] 0.2807 0.1252 0.001980       0.004369
#> rates[2,1] 0.2954 0.1309 0.002070       0.004019
#> rates[1,2] 0.2436 0.1569 0.002481       0.010587
#> rates[2,2] 0.2574 0.1613 0.002550       0.011070
#> rates[1,3] 0.4757 0.1732 0.002739       0.015103
#> rates[2,3] 0.4473 0.1817 0.002873       0.015918
#> 
#> 2. Quantiles for each variable:
#> 
#>               2.5%    25%    50%    75%  97.5%
#> weights    0.03363 0.2472 0.5225 0.7642 0.9780
#> rates[1,1] 0.03949 0.2363 0.2587 0.2939 0.6252
#> rates[2,1] 0.04734 0.2370 0.2647 0.3477 0.6103
#> rates[1,2] 0.06036 0.1492 0.1686 0.3280 0.6699
#> rates[2,2] 0.05494 0.1511 0.1763 0.3500 0.6801
#> rates[1,3] 0.05832 0.3658 0.5662 0.5928 0.6601
#> rates[2,3] 0.05077 0.3097 0.5420 0.5901 0.6531

As you can see that the median of the weights is roughtly 50%, which indicates that greta wasn’t able to differentiate the mixture of two multinomial distributions. Did I do something wrong here? Thank you!

Hi Zhi.

Look at the traces or distributions of weights from the different Chains. bayesplot::mcmc_dens_chains(draws_rates, regexp = “w”)

Since the fit for the different chains might not align to the same weight, so the summary does not give much real information regarding the fit in this situation.

Thank you @thorvall. Yeah, I noticed that too. This is essentially a toy example of the latent Dirichlet allocation model. Now, I am worried about whether it is possible to implement a latent variable in greta.