Problem with latent variable

I have two different estimates of an unknown variable with a known distribution. Each estimate has a different distribution of noise. I also have observations of a variable that depends on the same unknown variable.

I have tried to model it with a latent variable, but the samples I get seem to make no sense.

Can anyone please give me a hint of what is wrong with the model?

library(greta)
rm(list = ls())

#generation of latent variable (unavailable for the model)
real_shape=3
real_rate=0.01
latent_variable <- rgamma(10000, shape = real_shape, rate = real_rate)

#estimates (available)
variable1 <- latent_variable + rnorm(length(latent_variable), mean=10, sd=20)
variable2 <- latent_variable + rnorm(length(latent_variable), mean=20, sd=5)

#data depending on latent variable (available)
real_coef <- 1.5
data <-
    latent_variable * latent_variable * real_coef +
    rnorm(length(latent_variable), 0, 500)

#model variables
var1 <- as_data(variable1)
var2 <- as_data(variable2)

# transformed variables
dist_var1 <- fitdistrplus::fitdist(variable1[variable1 > 0], "gamma")
dist_var2 <- fitdistrplus::fitdist(variable2[variable2 > 0], "gamma")

#a priori distributions
#standard deviaton of the prediction error
sd <- cauchy(0, 10, truncation = c(0, Inf))
#estimate of the coefficient of the relationship between the latent variable and the observed variable
coef <- normal(0,10)
#estimate of the shape and rate of the distribution of the latent variable from the available data
shape <-
    normal(
        0.5 * (
            dist_var1$estimate[["shape"]] + dist_var2$estimate[["shape"]]
        ),
        dist_var1$sd[["shape"]] + dist_var2$sd[["shape"]]
    )
rate <-
    normal(
        0.5 * (
            dist_var1$estimate[["rate"]] + dist_var2$estimate[["rate"]]
        ),
        dist_var1$sd[["rate"]] + dist_var2$sd[["rate"]]
    )

#latent variable
latent_variable_estimate <- gamma(shape = shape, rate = rate, dim = length(latent_variable))
#standard deviations of the noise of the two estimates of the latent variable
sd_var1 <- cauchy(0, 0.5, truncation = c(0, Inf))
sd_var2 <- cauchy(0, 0.5, truncation = c(0, Inf))
#relationship between the estimates and the latent variable
distribution(var1) <- normal(latent_variable_estimate, sd_var1)
distribution(var2) <- normal(latent_variable_estimate, sd_var2)

#prediction
predict_data <- function(values, k)
{
    prediccion <- k * values * values
}
prediction <- predict_data(values = latent_variable_estimate, k = coef)
distribution(data) <- normal(prediction, sd)

#model
m <- model(sd, coef, shape, rate, sd_var1, sd_var2)

#samples
samples <- mcmc(m, n_samples = 100, warmup=1000, n_cores=2, chains = 2,one_by_one = TRUE)
summary(samples)

I’m getting:

summary(samples)

Iterations = 1:100
Thinning interval = 1 
Number of chains = 2 
Sample size per chain = 100 

1. Empirical mean and standard deviation for each variable,
   plus standard error of the mean:

              Mean        SD  Naive SE Time-series SE
sd       2.892e+05 1.971e+03 1.394e+02      2.051e+02
coef    -8.384e-02 1.179e-01 8.339e-03      1.070e-02
shape    2.769e-01 2.622e-03 1.854e-04      5.651e-04
rate     2.110e-02 2.239e-04 1.584e-05      4.199e-05
sd_var1  3.560e+02 2.555e+00 1.807e-01      2.480e-01
sd_var2  3.645e+02 2.644e+00 1.870e-01      2.847e-01

2. Quantiles for each variable:

              2.5%        25%        50%       75%     97.5%
sd       2.855e+05  2.878e+05  2.894e+05 2.906e+05 2.927e+05
coef    -2.332e-01 -1.983e-01 -8.164e-02 3.274e-02 5.738e-02
shape    2.710e-01  2.752e-01  2.773e-01 2.788e-01 2.811e-01
rate     2.068e-02  2.094e-02  2.114e-02 2.127e-02 2.152e-02
sd_var1  3.516e+02  3.540e+02  3.559e+02 3.580e+02 3.607e+02
sd_var2  3.597e+02  3.627e+02  3.646e+02 3.666e+02 3.692e+02

Thank you!

Perhaps it’s having trouble sampling because your shape and rate parameters can be negative, but the gamma distribution they define is expecting positive values? If you add truncation = c(0, Inf) to both of those it should sample better.

If that’s not it, perhaps you could write out your model in statistical notation, and maybe the motivation. That would make it easier to see what you are aiming for!

Thank you for answering! I tried what you suggested, as well as increasing the warmup to 20000, and it didn’t work. The results are maybe less weird (coef is now positive), but still far from reasonable.

Iterations = 1:100
Thinning interval = 1 
Number of chains = 2 
Sample size per chain = 100 

1. Empirical mean and standard deviation for each variable,
   plus standard error of the mean:

             Mean        SD  Naive SE Time-series SE
sd      7.822e+04 8.413e+02 5.949e+01      1.202e+02
coef    2.123e+00 3.450e-02 2.439e-03      4.286e-03
shape   3.929e-01 2.978e-03 2.105e-04      8.727e-04
rate    2.072e-03 2.807e-05 1.985e-06      6.128e-06
sd_var1 1.870e+02 1.508e+00 1.066e-01      5.852e-01
sd_var2 1.916e+02 1.914e+00 1.353e-01      3.903e-01

2. Quantiles for each variable:

             2.5%       25%       50%       75%     97.5%
sd      7.698e+04 7.752e+04 7.800e+04 7.889e+04 7.973e+04
coef    2.055e+00 2.098e+00 2.121e+00 2.150e+00 2.201e+00
shape   3.883e-01 3.905e-01 3.925e-01 3.959e-01 3.973e-01
rate    2.022e-03 2.053e-03 2.069e-03 2.090e-03 2.138e-03
sd_var1 1.838e+02 1.858e+02 1.872e+02 1.880e+02 1.895e+02
sd_var2 1.881e+02 1.901e+02 1.913e+02 1.937e+02 1.945e+02

What puzzles me is that the values for coef, shape and rate in the samples have a very small variance. I would have assumed that if the model didn’t have enough information it wouldn’t converge and the samples would be quite different from one another.

So I assume something is wrong with the model, although I still don’t know what it is.

Have you checked that the chains converged before computing summary statistics? Ie. is this a problem with sampling or with the model not recovering the parameters you expect?

Could you please post a reproducible example of the problem model with your latest variant of the code, so we’re on the same page.

Hello, Nick. Thank you very much for your answer. Sorry to get back to you so late.

Here is the code I have right now:

library(greta)
rm(list = ls())

#generation of latent variable (unavailable for the model)
real_shape=3
real_rate=0.01
latent_variable <- rgamma(10000, shape = real_shape, rate = real_rate)

#estimates (available)
variable1 <- latent_variable + rnorm(length(latent_variable), mean=10, sd=20)
variable2 <- latent_variable + rnorm(length(latent_variable), mean=20, sd=5)

#data depending on latent variable (available)
real_coef <- 1.5

data <-
    latent_variable * latent_variable * real_coef +
    rnorm(length(latent_variable), 0, 500)

#model variables
var1 <- as_data(variable1)
var2 <- as_data(variable2)

# transformed variables
dist_var1 <- fitdistrplus::fitdist(variable1[variable1 > 0], "gamma")
dist_var2 <- fitdistrplus::fitdist(variable2[variable2 > 0], "gamma")

# a priori distributions
sd <- cauchy(0, 10, truncation = c(0, Inf))
#estimate of the coefficient of the relationship between the latent variable and the observed variable
coef <- normal(0,10)
#estimate of the shape and rate of the distribution of the latent variable from the available data
shape <-
    normal(
        0.5 * (
            dist_var1$estimate[["shape"]] + dist_var2$estimate[["shape"]]
        ),
        dist_var1$sd[["shape"]] + dist_var2$sd[["shape"]],
        truncation = c(0, Inf)
    )
rate <-
    normal(
        0.5 * (
            dist_var1$estimate[["rate"]] + dist_var2$estimate[["rate"]]
        ),
        dist_var1$sd[["rate"]] + dist_var2$sd[["rate"]],
        truncation = c(0, Inf)
    )

#latent variable
latent_variable_estimate <- gamma(shape = shape, rate = rate, dim = length(latent_variable))
#standard deviations of the noise of the two estimates of the latent variable
sd_var1 <- cauchy(0, 0.5, truncation = c(0, Inf))
sd_var2 <- cauchy(0, 0.5, truncation = c(0, Inf))
#relationship between the estimates and the latent variable
distribution(var1) <- normal(latent_variable_estimate, sd_var1)
distribution(var2) <- normal(latent_variable_estimate, sd_var2)

#prediction
predict_data <- function(values, k)
{
    prediccion <- k * values * values
}
prediction <- predict_data(values = latent_variable_estimate, k = coef)
distribution(data) <- normal(prediction, sd)

#model
m <- model(sd, coef, shape, rate, sd_var1, sd_var2)

#samples
samples <- mcmc(m, n_samples = 100, warmup = 20000, n_cores=2, chains = 2,one_by_one = TRUE)
summary(samples)

And I get:

Iterations = 1:100
Thinning interval = 1 
Number of chains = 2 
Sample size per chain = 100 

1. Empirical mean and standard deviation for each variable,
   plus standard error of the mean:

             Mean        SD  Naive SE Time-series SE
sd      7.805e+04 5.805e+02 4.105e+01      1.454e+02
coef    2.151e+00 4.769e-02 3.372e-03      6.471e-03
shape   3.891e-01 4.868e-03 3.442e-04      3.640e-04
rate    2.056e-03 3.803e-05 2.689e-06      8.703e-06
sd_var1 1.868e+02 1.218e+00 8.612e-02      2.015e-01
sd_var2 1.921e+02 1.118e+00 7.907e-02      2.296e-01

2. Quantiles for each variable:

             2.5%       25%       50%       75%     97.5%
sd      7.712e+04 7.751e+04 7.800e+04 7.854e+04 7.907e+04
coef    2.076e+00 2.118e+00 2.142e+00 2.179e+00 2.253e+00
shape   3.828e-01 3.846e-01 3.892e-01 3.937e-01 3.953e-01
rate    1.992e-03 2.032e-03 2.056e-03 2.081e-03 2.136e-03
sd_var1 1.843e+02 1.859e+02 1.869e+02 1.878e+02 1.889e+02
sd_var2 1.891e+02 1.914e+02 1.920e+02 1.928e+02 1.943e+02

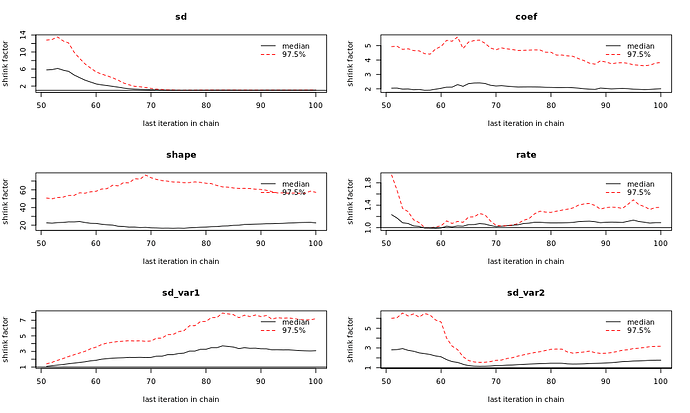
I have tested the convergence with coda, as you suggested:


and it seems that the model has not converged.

I’m going to try even more iterations, but, is there something wrong with the model that makes it difficult for it to converge?

Thank you very much for your time!

I think the first problem with the sampling here is just that you have a parameter
space with over 10,000 dimensions. There 10,000 latent variables, and MCMC sampling (even with HMC) in such high dimension is quite difficult; see the curse of dimensionality:
https://en.wikipedia.org/wiki/Markov_chain_Monte_Carlo#Reducing_correlation.
In fact, a fairly standard ‘difficult’ test for a sampler is a simple 1000-dimensional standard normal distribution.

So for testing your model, I’d recommend reducing the size of the data and the latent variable considerably. When I change the number of samples to 100 (latent_variable <- rgamma(100, shape = real_shape, rate = real_rate)), and reset the MCMC setting to their defaults (samples <- mcmc(m)) it takes 30s and converges well for most parameters.

Notation

Here’s an attempt to write out the statistical notation for the model you want
to fit, based on the code you have here:

y \sim N(k z_i^2, \sigma_{1}^2) \\ x_{i,1} \sim N(z_i, \sigma_{2}^2) \\ x_{i,2} \sim N(z_i, \sigma_{3}^2) \\ z_i \sim gamma(\alpha, \beta) \\ \sigma_1 \sim C^+(0, 10) \\ \sigma_2, \sigma_3 \sim C^+(0, 0.5) \\ k \sim N(0, 10^2) \\ \alpha \sim N^+(3.3, 0.1^2) \\ \beta \sim N^+(0.01, 0.0003^2) \\

where x_{i, 1} and x_{i, 2} are var1 and var2 in your code, y is data, and z, k, \alpha and \beta are latent_variable_estimate, coef, shape and rate respectively. Does this seem like what you are trying to model?

Extra bias

If so, it looks like when simulating data you are adding a lot of bias to your samples of var1 and var2 (adding means to the noise of 10 and 20, respectively) which isn’t accounted for in your model.

Double dipping for priors

You also have very informative priors for shape and rate, which influence the latent variable prior, but are based on var1 and var2. It seems strange to use that data twice, and the estimates of shape and rate parameters from the noisy data won’t be great priors for the parameters of the latent variable. Just using that information once, and using more vague priors (or informative priors from some other source of information) for shape and rate seems more reasonable.

Identifiability

With your choice of true values for shape and rate, the values for the expression latent_variable * latent_variable * real_coef (i.e. data without the observation noise), can be massive; half of them are greater than 100,000. With such extreme values, some of the other parameters seem to be poorly identified. I’m not sure why, but it would be worth exploring to determine under what conditions this model is identified. With true_shape = 2 and true_rate = 1, there seems to be no problem sampling the parameters and getting reasonable results.

Tuning HMC

If you want to fit a model with this many parameters to your real data then
you can, but you may need to play with the HMC settings a bit. greta’s HMC
sampler automatically tunes the step size (of the leapfrog integrator), but
not the number of leapfrog steps. So you could try changing those until you
find settings that sample efficiently. Efficiency here is normally measured in
terms of the minimum number of effective samples (i.e. for the variable with
the lowest effective samples) per unit time, so something like:

Lmin <- 15
time <- system.time(
  samples <- mcmc(m, sampler = hmc(Lmin = Lmin, Lmax = Lmin + 5))
)
efficiency <- min(coda::effectiveSize(samples)) / time[3]
efficiency

Another thing that might be worthwhile here is to use lots of chains. Since greta can efficiently split computation across lots (10s, 100s) of chains even if you don’t have that many cores, and share tuning information between chains during warmup, it’s sometimes easier to tune the sampler and get lots of posterior samples by upping the number of chains, rather than the number of samples.

Code

Putting that all together, here’s some code that seems to work well:

library(greta)
rm(list = ls())
set.seed(2020-01-07)

# generation of latent variable (unavailable for the model)
real_shape <- 2
real_rate <- 1
latent_variable <- rgamma(100, shape = real_shape, rate = real_rate)

# estimates (available)
variable1 <-
  latent_variable + rnorm(length(latent_variable), mean = 0, sd = 20)
variable2 <-
  latent_variable + rnorm(length(latent_variable), mean = 0, sd = 5)

# data depending on latent variable (available)
real_coef <- 1.5
data <-
  latent_variable * latent_variable * real_coef +
  rnorm(length(latent_variable), 0, 50)

# model variables
var1 <- as_data(variable1)
var2 <- as_data(variable2)

# a priori distributions
sd <- cauchy(0, 10, truncation = c(0, Inf))

# estimate of the coefficient of the relationship between the latent variable
# and the observed variable
coef <- normal(0, 10)

# estimate of the shape and rate of the distribution of the latent variable from
# the available data
shape <- normal(0, 5, truncation = c(0, Inf))
rate <- normal(0, 5, truncation = c(0, Inf))

# latent variable
latent_variable_estimate <-
  gamma(shape = shape,
        rate = rate,
        dim = length(latent_variable))

# standard deviations of the noise of the two estimates of the latent variable
sd_var1 <- cauchy(0, 0.5, truncation = c(0, Inf))
sd_var2 <- cauchy(0, 0.5, truncation = c(0, Inf))

# relationship between the estimates and the latent variable
distribution(var1) <- normal(latent_variable_estimate, sd_var1)
distribution(var2) <- normal(latent_variable_estimate, sd_var2)

# prediction
predict_data <- function (values, k) {
  k * values * values
}
prediction <-
  predict_data(values = latent_variable_estimate, k = coef)
distribution(data) <- normal(prediction, sd)

# model
m <- model(sd, coef, shape, rate, sd_var1, sd_var2)

# samples
Lmin <- 15
time <- system.time(
  samples <- mcmc(
    m,
    chains = 50,
    warmup = 1000,
    sampler = hmc(Lmin = Lmin, Lmax = Lmin + 5)
  )
)

(efficiency <- min(coda::effectiveSize(samples))/time[3])
coda::gelman.diag(samples)
coda::effectiveSize(samples)
plot(samples)
summary(samples)
1 Like

Thank you very much!
That is really helpful. I’ll try to follow your advice.