RFF code to build from

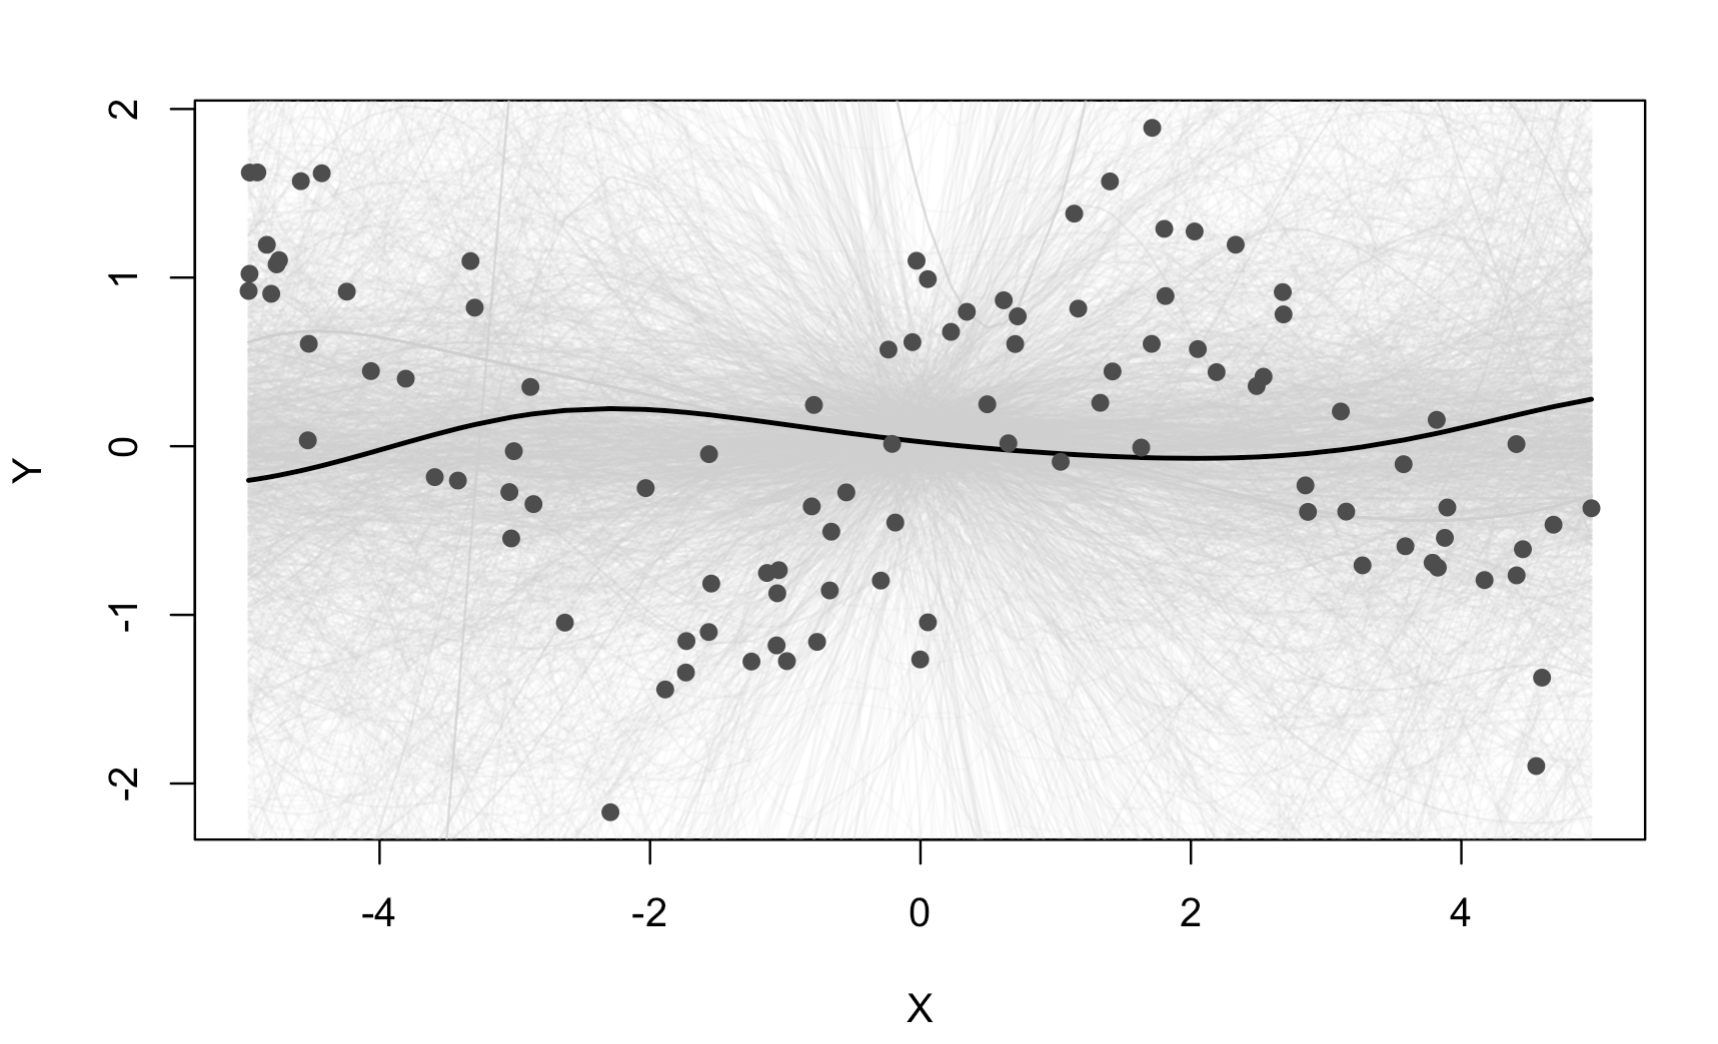
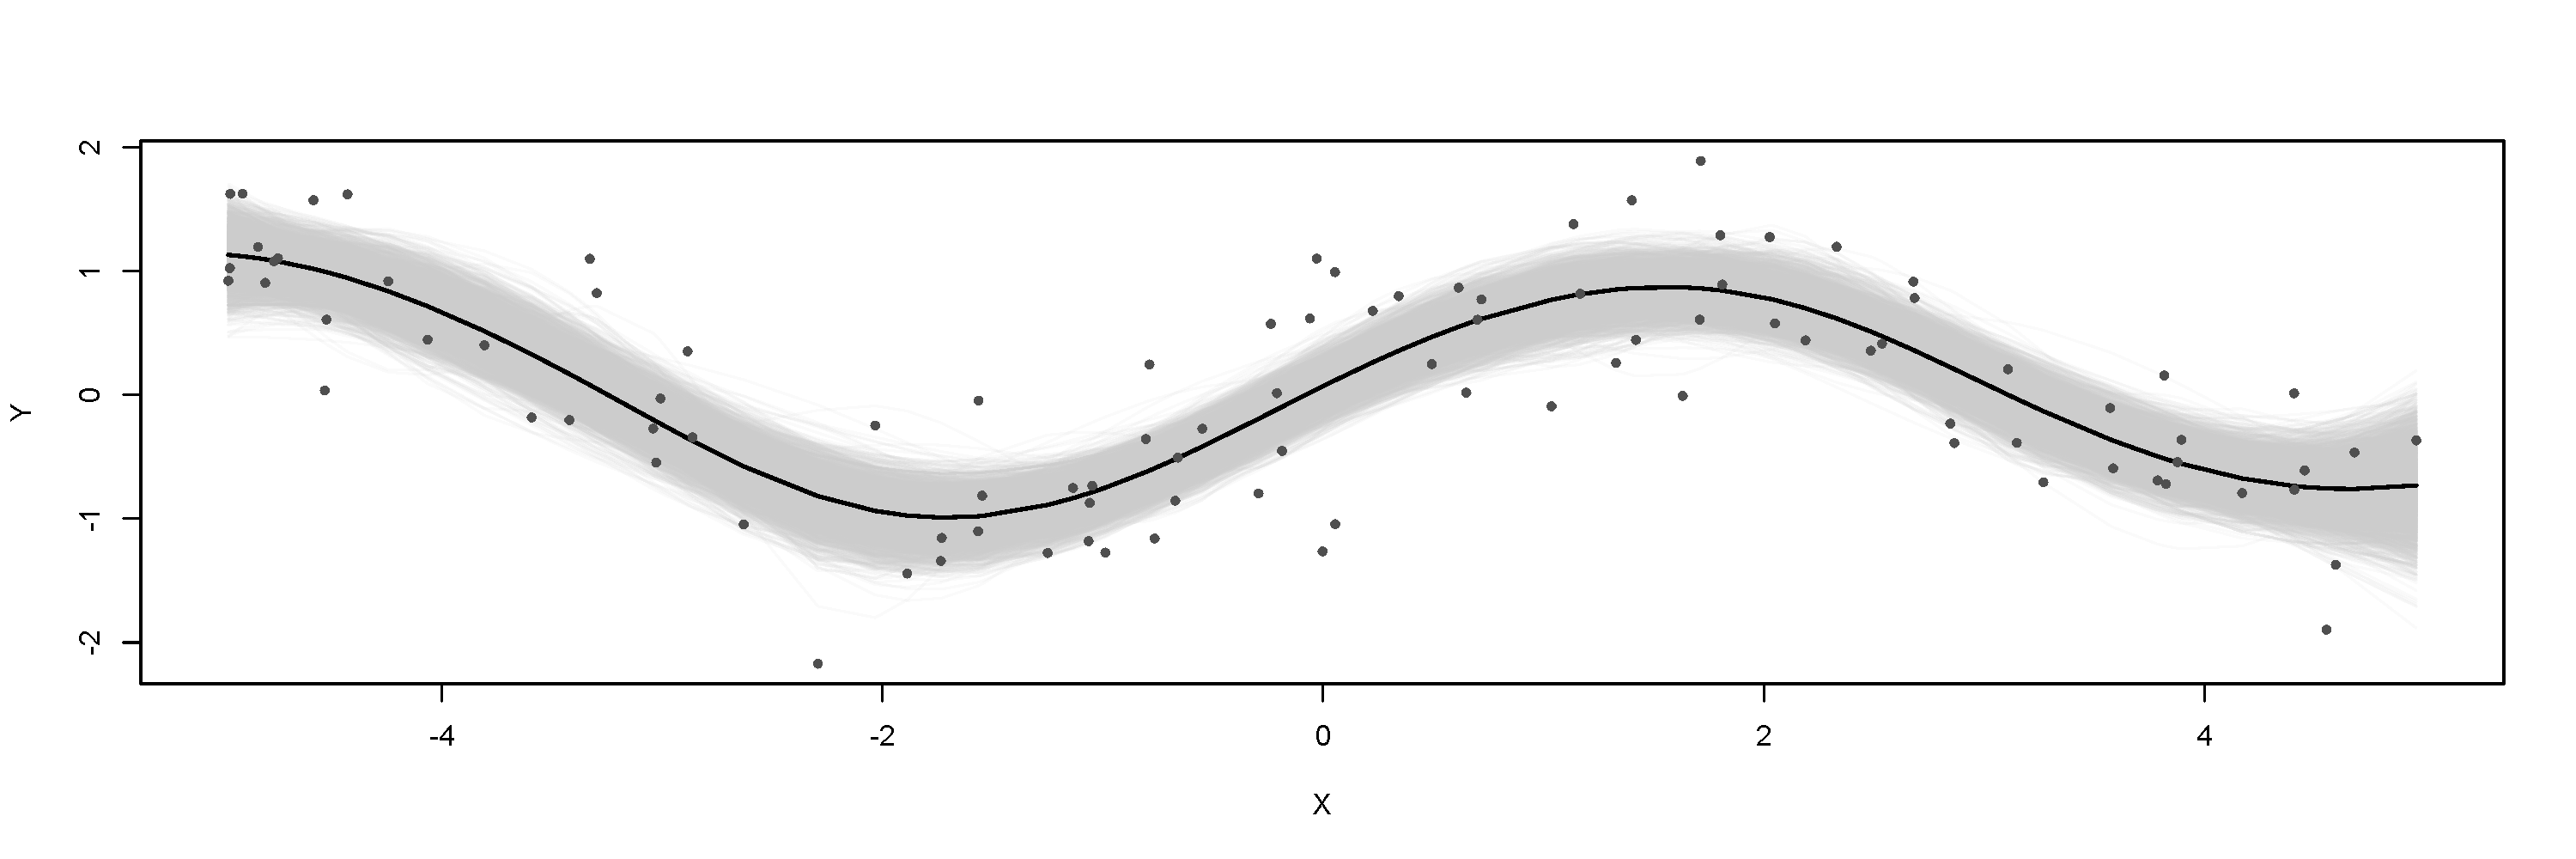
some people have requested RFF greta code - im not sure it works as i wrote it a while back and never tested it, but putting it here incase anyone is curious

Y=
X=
K=500 # number features

omega<-t(as.matrix(rnorm(K)))

library(greta)
tau<-exponential(1) # ridge penalty
bw<-gamma(1,1) # length scale
sigma<-gamma(1,1) # noise

W <- normal(0, 1, dim = c(2K, 1))tau
feat<-X%
%(omega
bw)

rff<-sqrt(1/K)cbind(sin(feat),cos(feat))
mu <- rff %
% W
distribution(Y) <- normal(mu, sigma)

model <- model(W, tau, bw)

draws <- mcmc(model, n_samples = 1000,control = list(Lmin = 10, Lmax = 20, epsilon = 1e-5))

Thanks Sam!
Here’s a version with some formatting errors removed, a slight change of prior, example data and plot, and bugfix due to a change to the greta API:

set.seed(2020-02-12)
n <- 100
X <- sort(runif(n, -5, 5))
Y <- sin(X) + rnorm(n, 0, 0.5)

K <- 500 # number features
omega <- t(as.matrix(rnorm(K)))

library(greta)

tau <- exponential(1)  # ridge penalty
bw <- gamma(1, 1)  # length scale
sigma <- normal(0, 0.5, truncation = c(0, Inf))  # noise

W <- normal(0, 1, dim = c(2 * K, 1)) * tau
feat <- X %*% (omega * bw)
rff <- sqrt(1 / K) * cbind(sin(feat), cos(feat))
mu <- rff %*% W

distribution(Y) <- normal(mu, sigma)

model <- model(tau, bw, sigma)

draws <- mcmc(model)
plot(draws)
coda::gelman.diag(draws)

# plot samples and posterior mean of mu
mu_draws <- calculate(mu, values = draws)
mu_samples <- as.matrix(mu_draws)
mu_mean <- colMeans(mu_samples)

# plot
plot(Y ~ X, ylim = range(Y), type = "n")
for (i in seq_len(nrow(mu_samples))) {
  lines(mu_samples[i, ] ~ X, col = rgb(0.8, 0.8, 0.8, 0.1))
} 
lines(mu_mean ~ X, lwd = 2)
points(Y ~ X, pch = 16, col = grey(0.3))

Not sure why it’s so uncertain though.

Thats strange i ran that exact code and got this - maybe HMC got stuck?

and gelman.diag is 1.04

Weird! I get the same result as you if I roll back to the CRAN (rather than GitHub) release of greta. I’ll do some investigating.

Phew, I’m glad you posted that!
Found a bug in the development branch I was working on that wasn’t picked up by any tests. All fixed up so it works fine now, and gives the same plot as yours.