Hi all.
So I’m working on a greta model at the moment which involves inferring establishment risk of regionally invasive species into lakes. As part of the model I’ve got an interaction effect between two standardised human-related variables (distance from lake to nearest lake populated with focal species and Human Footprint Index).
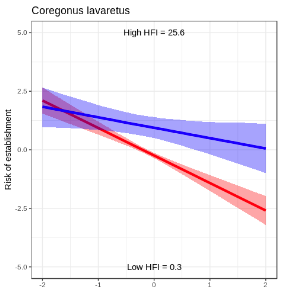
I wanted to be able to show the effect of parameter 1 on establishment risk for high and low values of parameter 2. With some help from Nick, I was able to put this together.
#Simulate range of values for parameter 1
param1 <- seq(-2, 2, length.out = 100)
#Simulate fixed values for parameter two. In this case I’m looking at a low value of parameter 2, 2 SDs below the mean.
param2 <- rep(-2, 100)
X_new <- cbind(param1, param2, param1 * param2)
effect <- X_new %*% beta[idx] # idx should be a vector which selects the corresponding beta values
effect_draws <- calculate(effect, values=draws) # draws being your mcmc draws for the greta model
effect_draw_mat <- as.matrix(effect_draws)
CIs <- t(apply(effect_draw_mat, 2, quantile, c(0.025, 0.5 , 0.975)))
That last command should give your mean vector, as well as upper and lower credible intervals.
Gave me the following (using some ggplot trickery, let me know if that’s of interest).